Your first capture
This chapter captures some signals and looks at them. It leaves triggers, decoders and industrial inputs to the chapters that cover them.
You can follow every step without an instrument: pick a demo device instead of a real one at step 1 and the rest is identical.
1. Open a workspace
Connect the logic analyzer and start ScanaStudio. The home screen lists what it found, and every device it knows about as a demo:
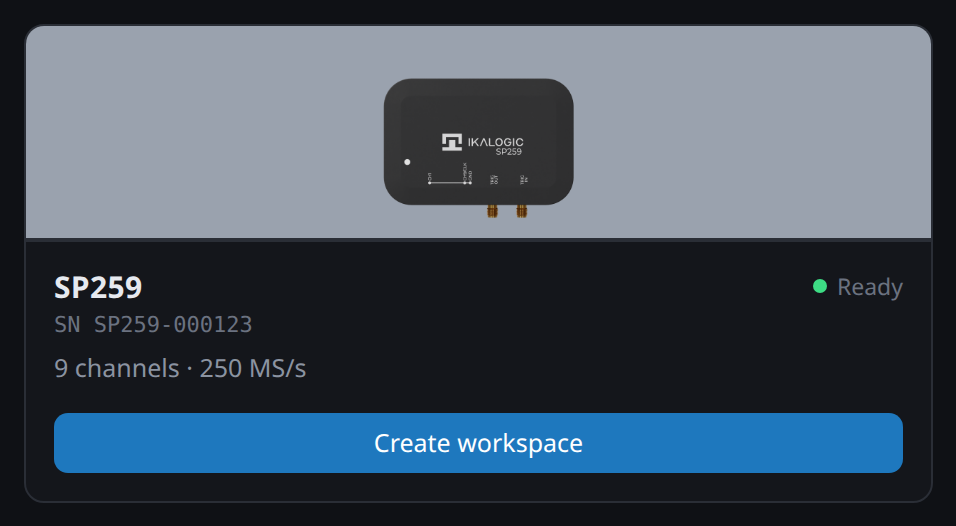
Click Create workspace. If the device is not listed, check the driver: on Windows the USB driver package is installed separately, and on Linux the udev rule has to be in place and the device reconnected after it was added. Installing ScanaStudio covers both.
2. Connect the probes
Before connecting anything:
- Check that the voltages on the board are within the input range of the logic analyzer.
- Check that the board is not connected to the mains and that there is no risk of a ground loop. A ground loop can destroy the board, the logic analyzer, or the computer it is plugged into.
- Connect the ground probe to the ground of the board. A good ground connection is the difference between clean signals and a capture full of glitches.
- Power the board.
3. Capture
The Device card holds the acquisition settings. The defaults are a reasonable starting point:
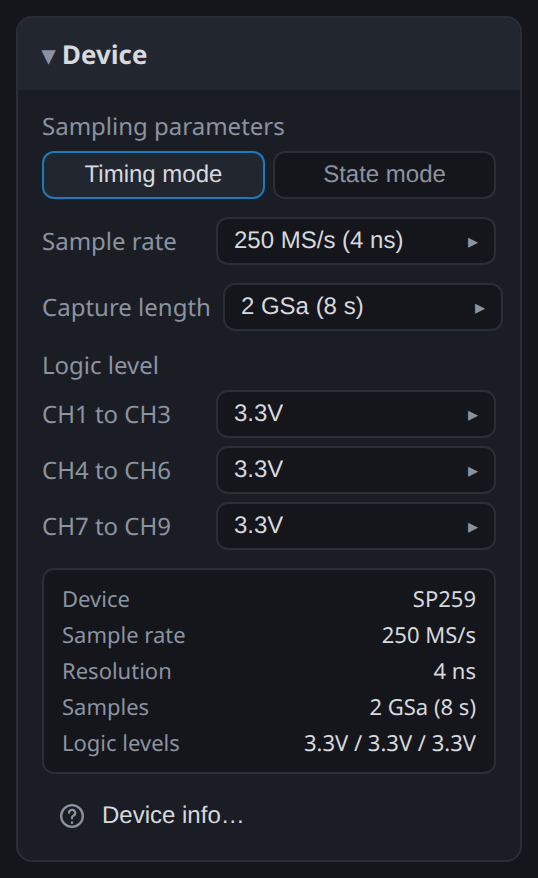
Two of them matter now. Sample rate sets the resolution, shown next to it in nanoseconds: a signal is only measurable if its shortest pulse lasts several samples. Capture length sets how many samples the device takes, and the duration that adds up to. Together they are the trade you make on every capture: a high rate resolves fine detail, a long capture covers a rare event, and the device's memory limits the product of the two.
Logic level tells the front end where the threshold between 0 and 1 sits. Set it to the signalling voltage of the board, not to its supply.
Now click Start capture.
On a demo device ScanaStudio asks which protocol should generate the signals, because a demo device has no traffic of its own:
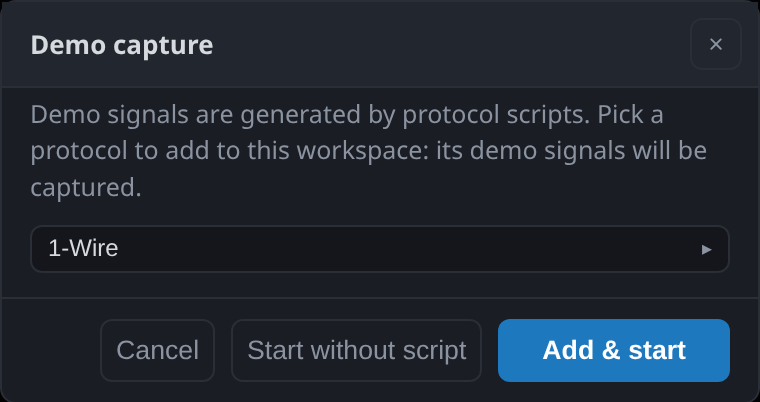
Pick one and choose Add & start, which also adds that decoder to the workspace, or Start without script for plain pseudo-random signals. With a real instrument this dialog does not appear.
4. Look at what you captured
The signals appear as they arrive:
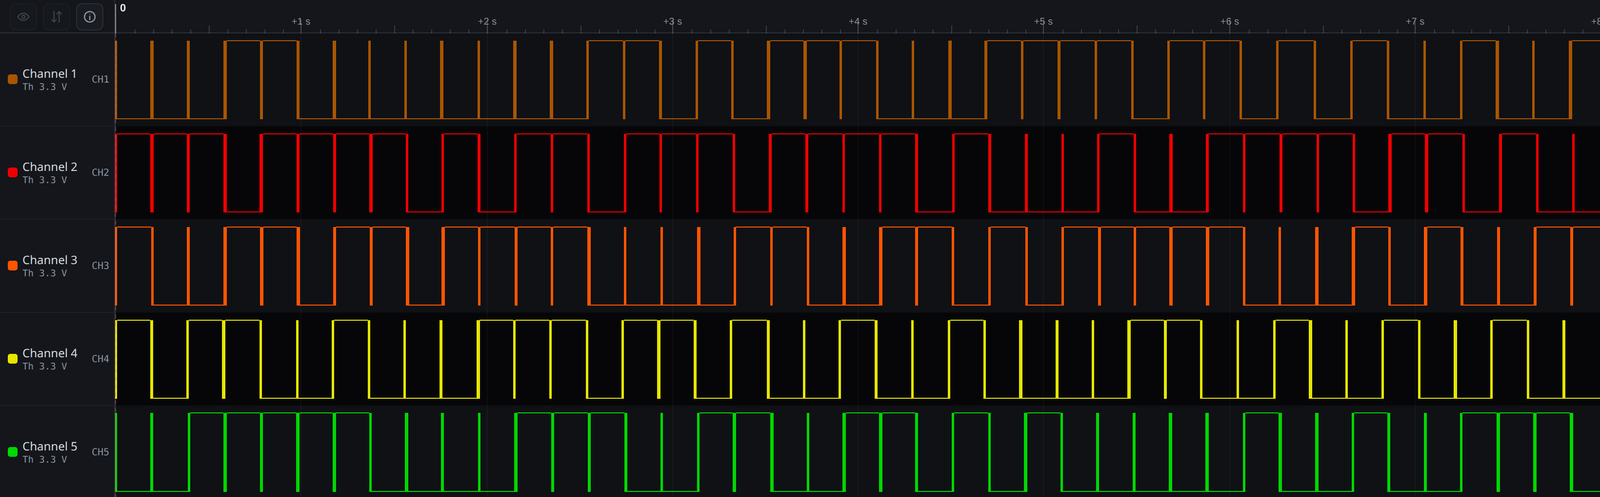
Use the zoom buttons at the bottom left of the waveform, or the mouse wheel, to move around. Navigating a capture covers the rest of the controls.
The status bar says what actually happened:

If the channels are flat, work through these in order:
- Nothing on any channel. Check the ground connection and that the board is powered.
- A channel stuck high or low. The threshold is wrong for that signal. Change the logic level in the Device card. On an SP259 the channels are grouped in threes and each group has its own threshold; on an SP1000G the threshold is a voltage you set per probe.
- A signal that looks like a solid block. You are zoomed out too far to see individual edges. Zoom in.
- Edges that come and go between captures. The sample rate is too low for the signal. Raise it, and lower the capture length to compensate if you run out of memory.
- Nothing interesting, because the event is rare. Set up a trigger so the device waits for the event instead of you. See Trigger.
Next
With signals on screen, the next step is usually to have ScanaStudio interpret them rather than read the edges yourself: see Protocol decoders.