Plotting decoded data
Some decoded values are numbers that change over time: a duty cycle, a frequency, a temperature, the output of an ADC. Read as a column of figures they are hard to follow. Drawn as a curve, the shape is immediately visible.
A virtual analog channel is that curve. It is drawn from values a decoder produced, and appears under the logic channels:
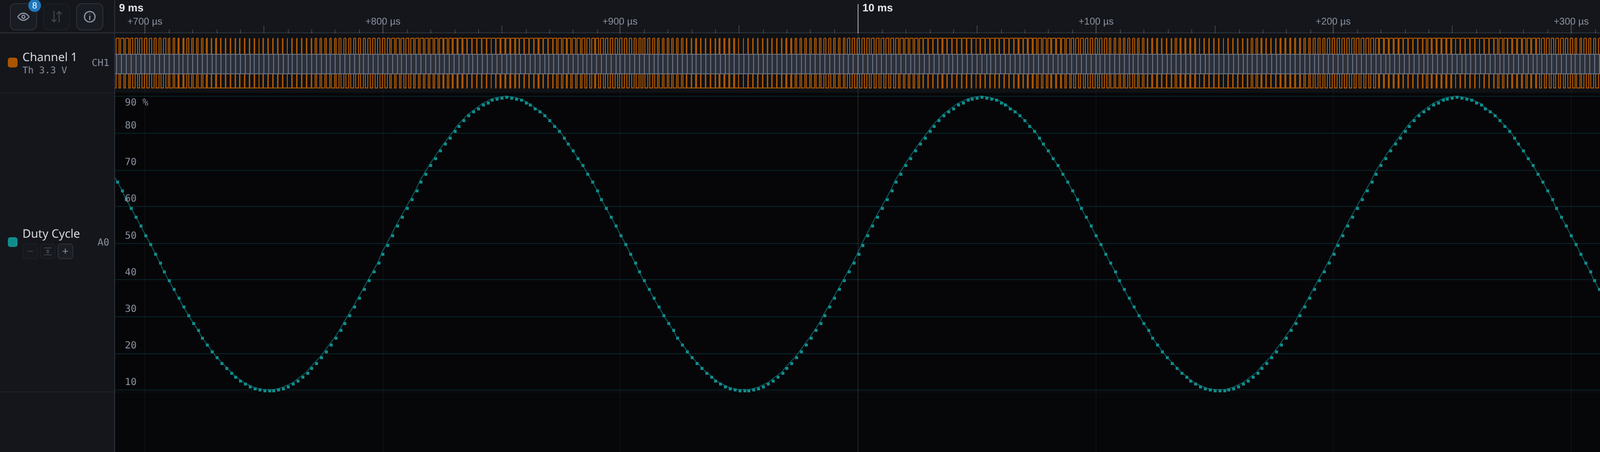
Above is a PWM signal on CH1. Nothing about the logic trace shows that its duty cycle is being swept, because every period looks like every other at this zoom. The curve below is the duty cycle of each period in turn, and the sweep is unmistakable.
Nothing here is an analog capture. The logic analyzer still records only 0 and 1. A virtual analog channel is a drawing of numbers the decoder computed from those edges, so its vertical axis is whatever the decoder measured, not volts.
Turning one on
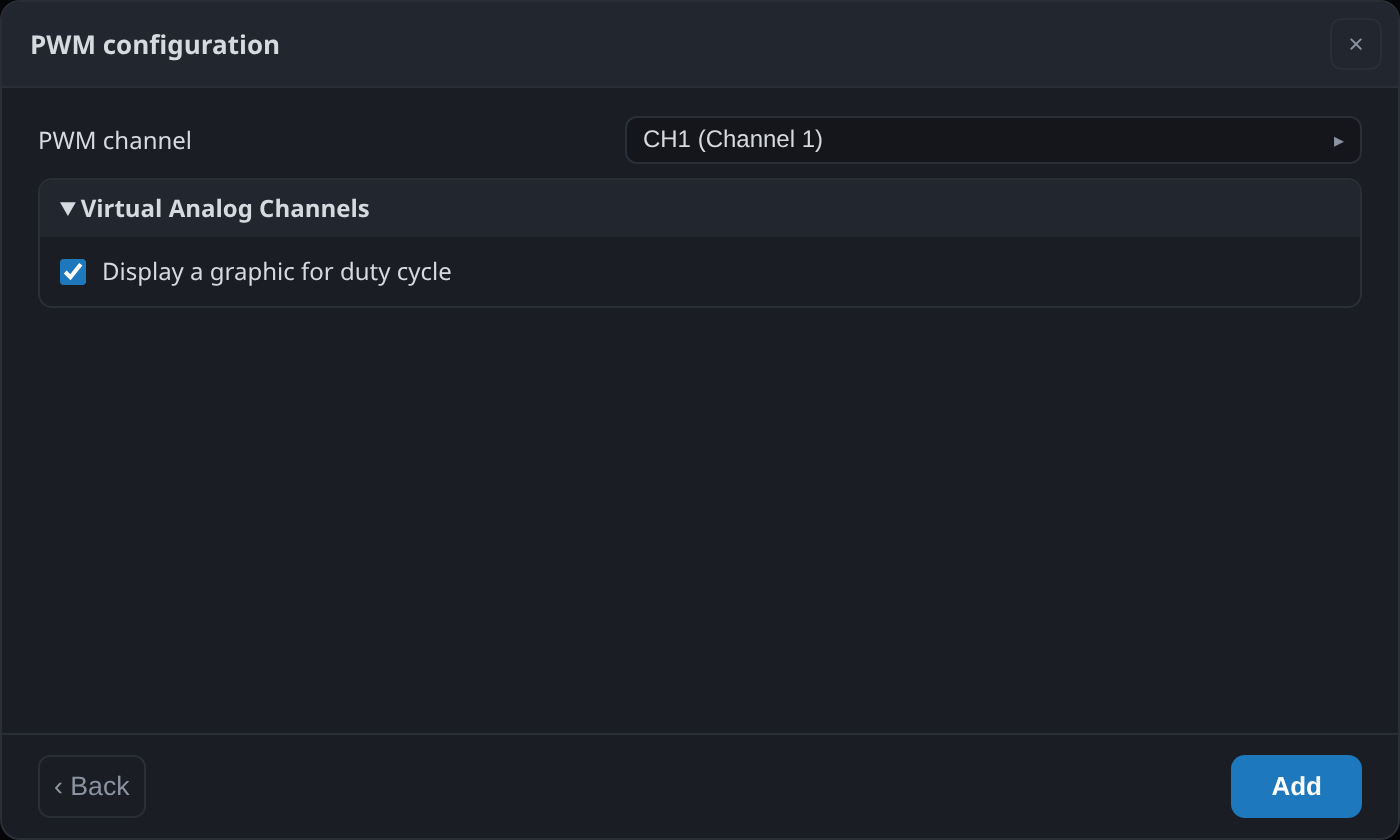
A virtual analog channel comes from a decoder, so it is switched on in that decoder's options when you add it:
The scripts that offer one, and what they plot:
| Script | What it plots |
|---|---|
| PWM | duty cycle, in percent |
| Frequency modulation | frequency, in Hz |
| Servomotor | angle or speed |
| ADC | the converted value |
| DHTxx | temperature and relative humidity |
| RGB LED | the colour components |
The channel appears after the logic channels once the decoder has run. On a device with many channels it can be below the bottom of the window, so scroll down, or hide the channels you are not using.
Adjusting the plot
By default the curve is scaled to fit the full range of the values in the capture. Right-clicking the channel header offers:
- Log or decimal scale, for a value whose interesting range spans orders of magnitude.
- Colour, so two curves on one screen can be told apart.
- Height, from minimum to maximum, which is the setting that matters most: a curve given one row of space shows a trend, and a curve given half the window shows detail.
The buttons on the channel header zoom the vertical scale and shift the offset, for when the interesting variation is small compared with the full range.
Typical uses
The clearest case is a signal whose meaning is in a property the eye cannot read off the edges. An FSK carrier is the standard example: two frequencies close enough that the logic trace looks like one continuous square wave, while a plot of frequency separates them into two flat levels and the data becomes readable.
The same applies to a temperature sensor polled over I2C, where you care about the trend and not about the transaction itself, and to a servo line, where you want the angle over time instead of a list of pulse widths.
Writing your own
A decoder script emits a virtual analog channel by adding values to it as it decodes. If you are comfortable with JavaScript and the protocol you need does not have one, see virtual analog channels in the scripting manual.