The ScanaStudio window
Everything in ScanaStudio is reachable from one window. This page names its parts; the chapters that follow describe what each one does.
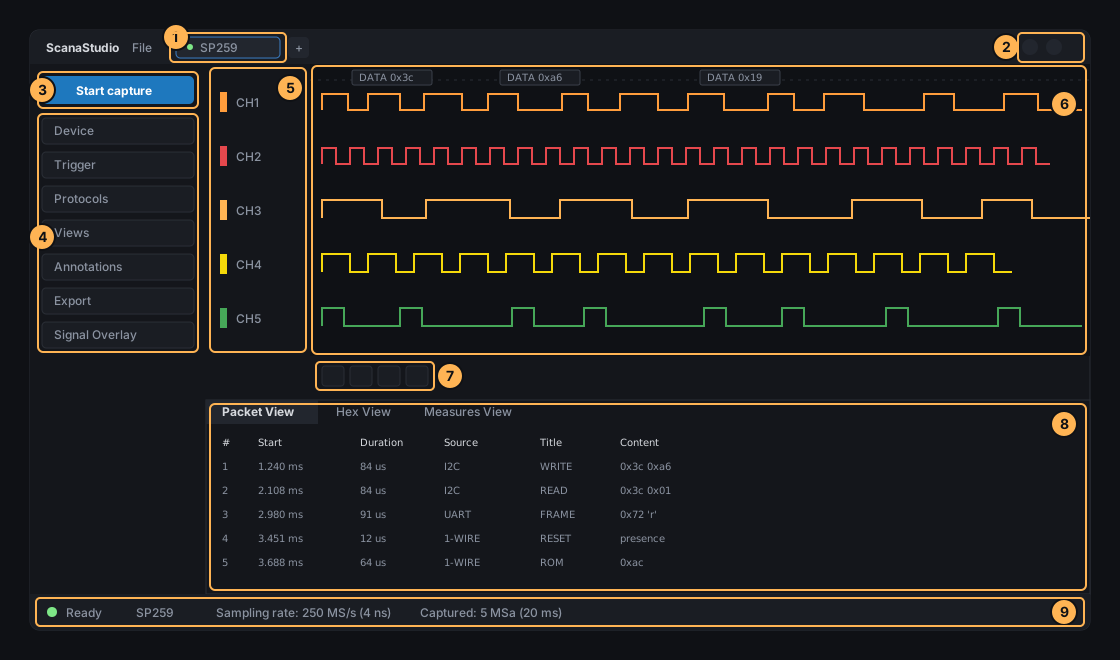
- Workspace tabs. One tab per open workspace, and
+to open another. The dot beside the name turns solid when the workspace has unsaved changes. - Settings and help. The gear opens the settings, which are searchable by name. The question mark opens this manual.
- Start capture. Starts the acquisition, and reads Stop while one is running.
- The dock. One card per group of controls: Device, Trigger, Protocols, Views, Annotations, Export and Signal Overlay, plus Pattern Generator on a device that has one. Click a heading to fold or unfold it.
- Channel headers. The name, colour and threshold of each channel. Drag one to reorder the channels, or use the header buttons to hide one.
- Waveform. The captured signals, with the decoded items drawn above the channel they came from. See Navigating a capture.
- Zoom controls. Zoom in, zoom on a selection, show the whole acquisition, zoom out.
- Bottom panel. Holds the views: Packet, Hex, Raw, Measures, Markers and Log. Any of them can be detached into a window of its own.
- Status bar. The state of the device, its sampling rate and resolution, and how many samples the last capture actually returned.
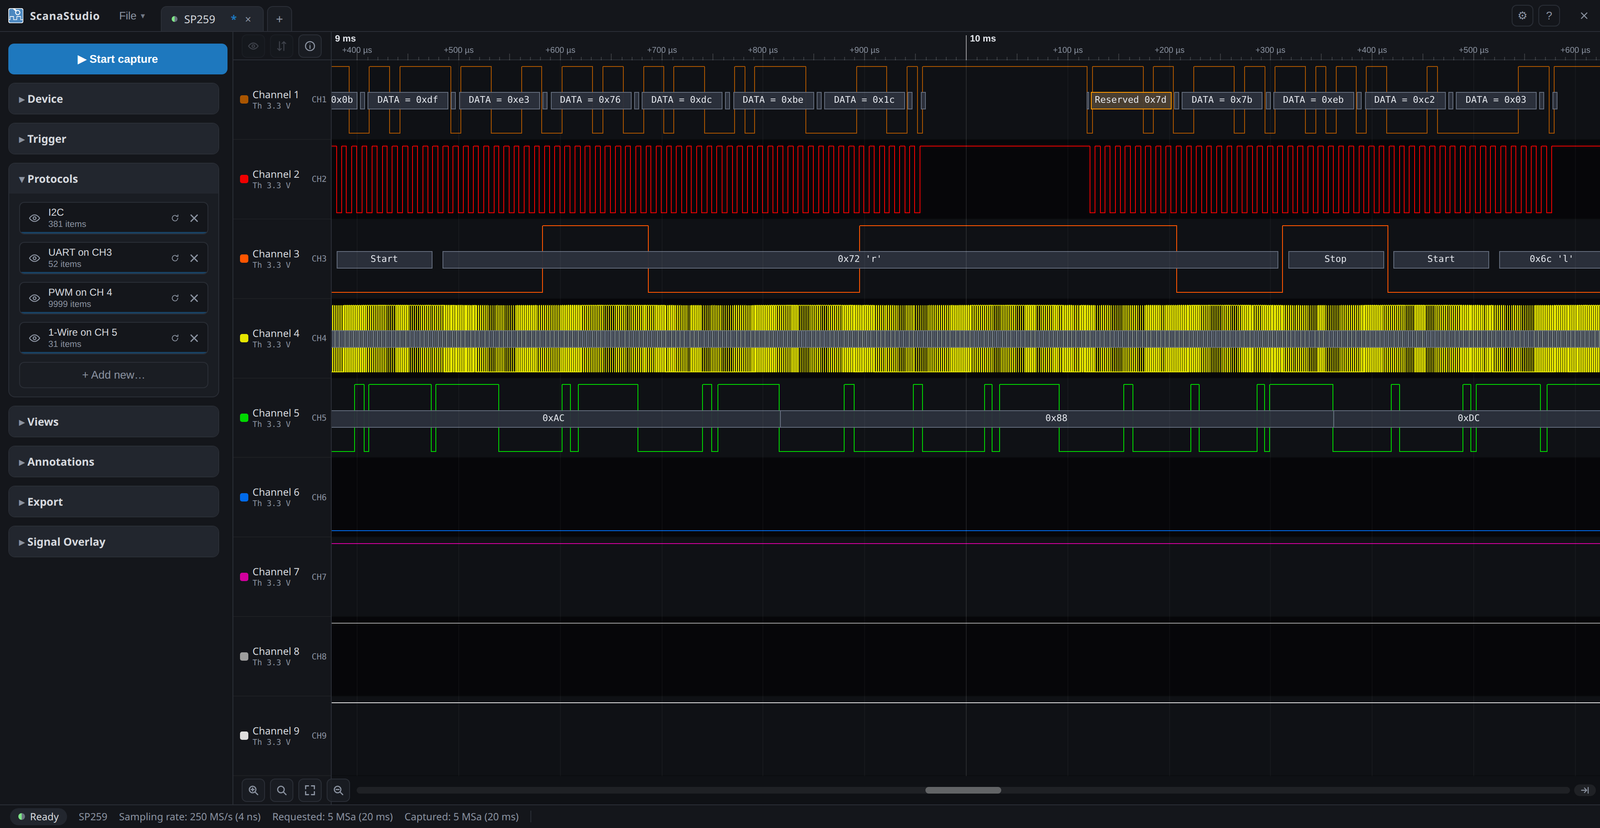
Here is the same window with a capture in it:
The dock
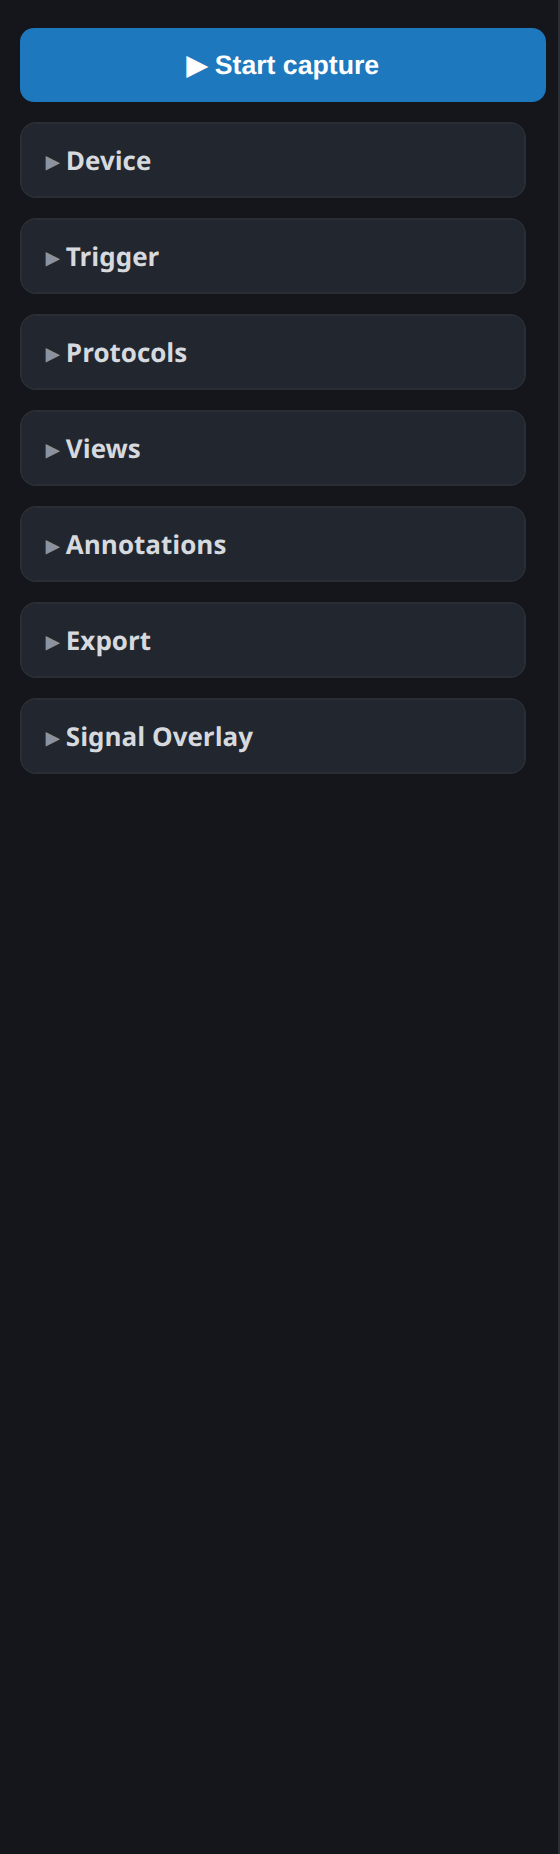
The dock is the map of the rest of this manual. Folded, it lists everything the software does to a workspace:
| Card | What it holds |
|---|---|
| Device | Sample rate, capture depth, logic levels, probes. Configuring the device |
| Trigger | Trigger mode, conditions A and B, trigger position. Trigger |
| Protocols | The decoders on this workspace. Protocol decoders |
| Pattern Generator | The generator script, on an SP1000G. Pattern generator |
| Views | Opens and closes the views. Views |
| Annotations | Markers and measurements. Markers and measurements |
| Export | Writing samples or decoded items to CSV. Exporting data |
| Signal Overlay | Drawing over a capture. Signal overlay |
Cards that do not apply to the connected device are not shown. An SE254 has no Pattern Generator card, because it has no outputs.
Workspaces
A workspace is one working session: a device, its configuration, the samples it captured, the decoders running on them, and the markers and measurements you added. One tab is one workspace.

Workspaces are stored on the server, not in the window. This changes a few things, explained in How ScanaStudio works. In practical terms: closing the window does not end a capture, and the same workspace can be open in two windows at once.
File > Save writes a workspace to a .scana file, which holds the samples together with the
configuration, the decoders, the markers and the measurements. ScanaStudio can also autosave
changed workspaces in the background; the interval and the size limit are in the settings.
Demo devices
Every device in the list can be opened without hardware. A demo workspace behaves like the real instrument, except that the signals are generated by a protocol script rather than sampled from a bus.
Demo mode is not only for trying the software out. You can build a workspace in advance, decoders and trigger and all, and connect the instrument later. It is also how a decoder script is tested, since the same script that decodes a protocol usually knows how to generate an example of it.
The status bar

Left to right: the state of the device, its name, the sampling rate with the resolution that implies, and the number of samples requested against the number actually captured. Those last two differ when a capture is stopped early or when the device runs out of buffer.